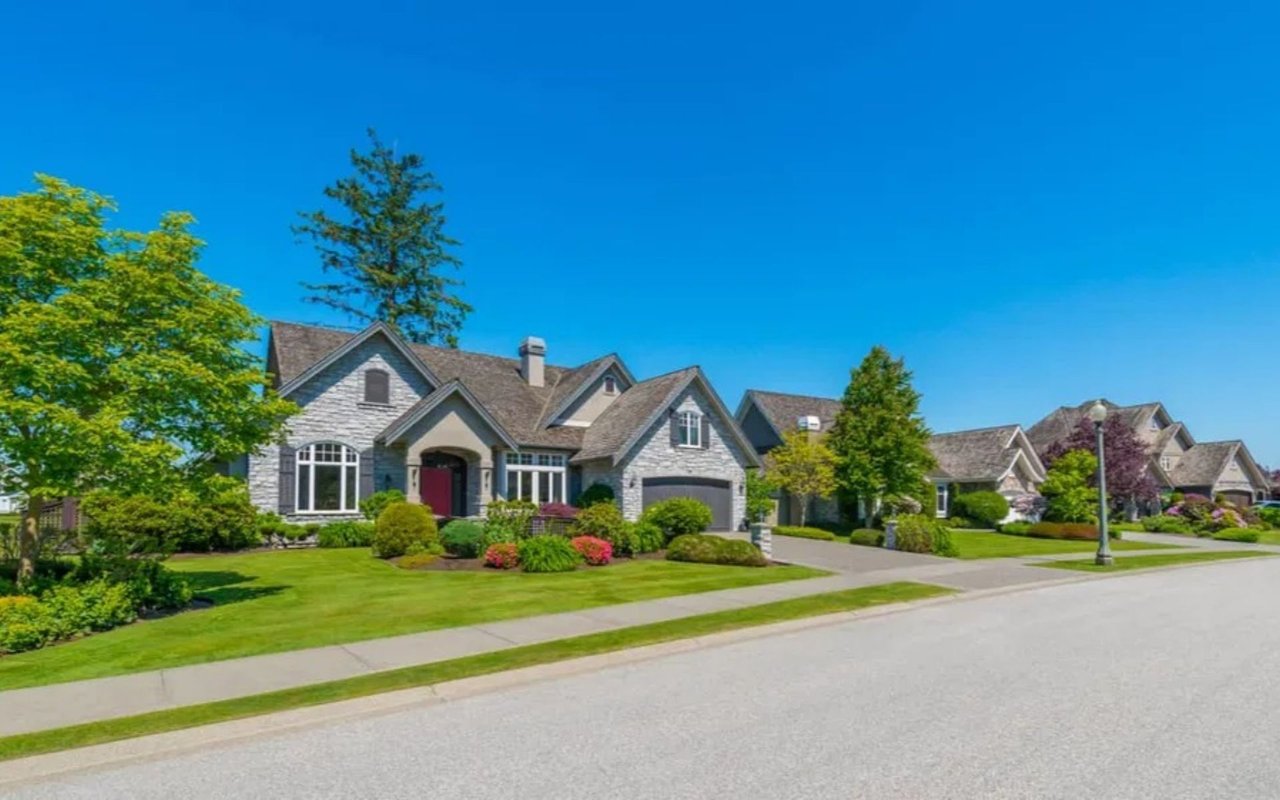
Welcome to
7,414 people live in Walkerton Properties, where the median age is 45.4 and the average individual income is $35,612. Data provided by the U.S. Census Bureau.
Total Population
Median Age
Population Density
Average individual Income
There's plenty to do around Walkerton Properties, including shopping, dining, nightlife, parks, and more. Data provided by Walk Score and Yelp.
Explore popular things to do in the area, including China House, Wayno’s Hometown Pizza, and Time Out Sports Bar & Grill.
| Name | Category | Distance | Reviews |
Ratings by
Yelp
|
|---|---|---|---|---|
| Dining · $ | 0.56 miles | 22 reviews | 4.5/5 stars | |
| Dining | 4.95 miles | 6 reviews | 4.3/5 stars | |
| Dining | 4.07 miles | 2 reviews | 5/5 stars | |
| Dining · $$ | 3.95 miles | 7 reviews | 4.1/5 stars | |
| Dining · $$ | 4.1 miles | 17 reviews | 4.1/5 stars | |
| Beauty | 0.56 miles | 1 review | 5/5 stars | |
|
|
||||
|
|
||||
|
|
||||
|
|
||||
|
|
||||
|
|
Walkerton Properties has 3,091 households, with an average household size of 2.38. Data provided by the U.S. Census Bureau. Here’s what the people living in Walkerton Properties do for work — and how long it takes them to get there. Data provided by the U.S. Census Bureau. 7,414 people call Walkerton Properties home. The population density is 76 and the largest age group is Data provided by the U.S. Census Bureau.
Total Population
Population Density Population Density This is the number of people per square mile in a neighborhood.
Median Age
Men vs Women
Population by Age Group
0-9 Years
10-17 Years
18-24 Years
25-64 Years
65-74 Years
75+ Years
Education Level
Total Households
Average Household Size
Average individual Income
Households with Children
With Children:
Without Children:
Blue vs White Collar Workers
Blue Collar:
White Collar:
Explore Other Communities

2200 N MICHIGAN ST PLYMOUTH, IN 46563
2200 N MICHIGAN ST PLYMOUTH, IN 46563